Introduction
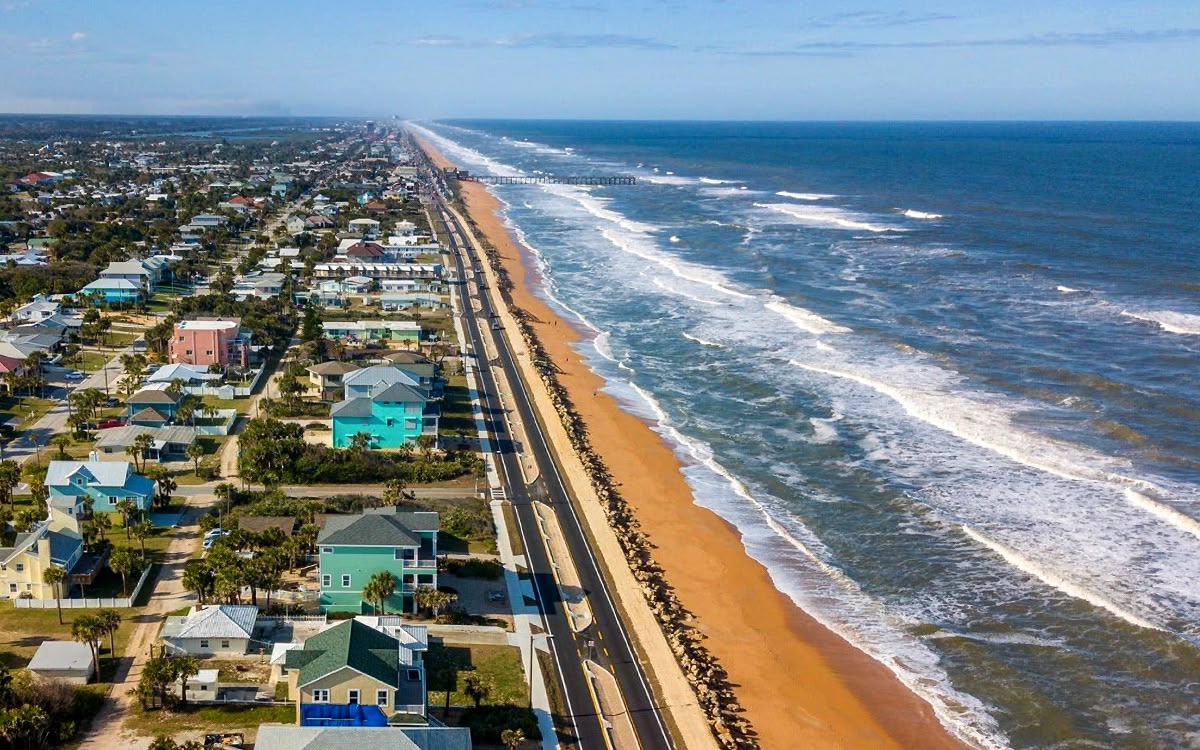
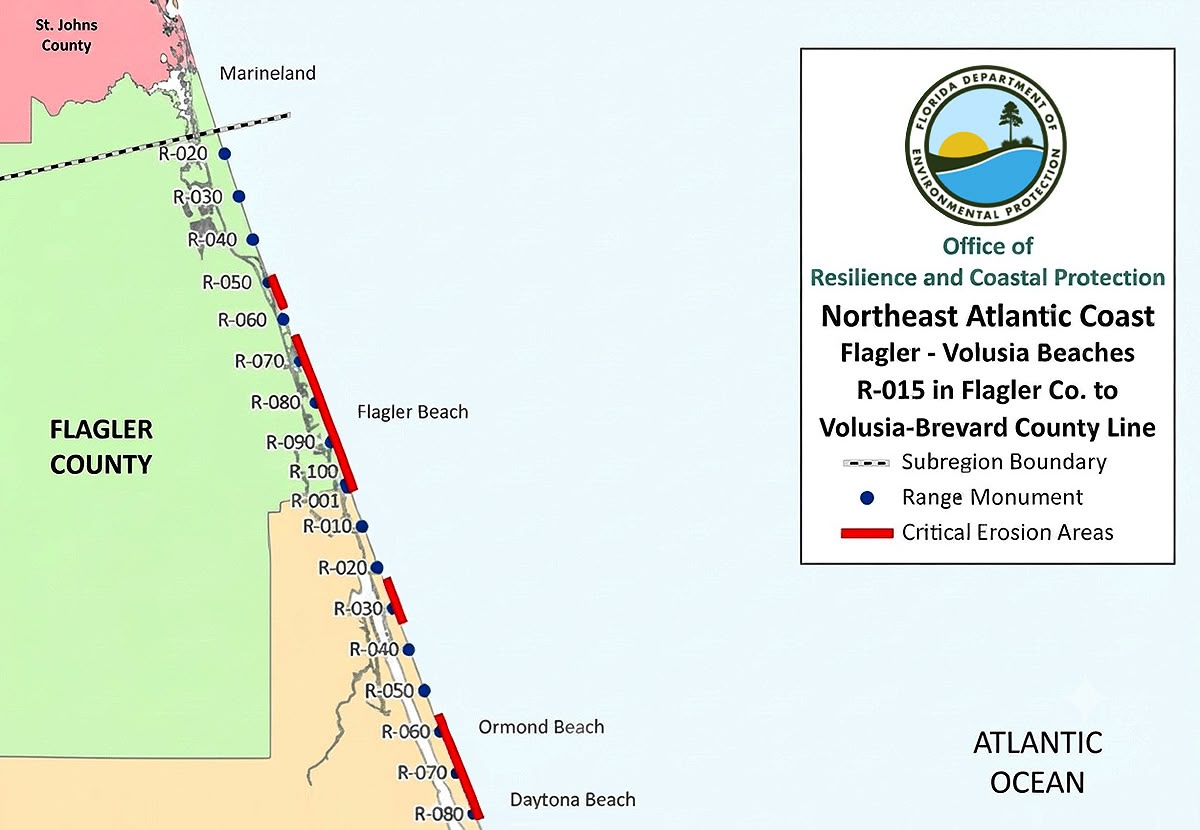
Coastal zones, particularly along Florida’s scenic A1A highway, are highly dynamic environments under constant threat from severe weather, rapid beach erosion, and rising sea levels, Figure 1. For municipal authorities, environmental agencies, and coastal engineers, understanding the precise topography of the beach and dune systems is critical for disaster preparedness, infrastructure protection, and habitat conservation.
As of 2025, “There are 8.1 miles of critically eroded areas that persist, and the loss of protective dunes continues to pose risks to coastal infrastructure and habitats. Rising sea levels, increased storm intensity and frequency, linked to climate change, add further complexity to the region’s recovery and resiliency efforts”.[1]
Traditional surveying methods often fall short in these environments, as sand dunes change rapidly and are difficult to map accurately on foot over large areas. This is where UAV LiDAR (Light Detection and Ranging) technology becomes indispensable. Unlike optical cameras, LiDAR can penetrate coastal vegetation to map the true ground surface and capture high-density 3D data of shifting sands with centimeter-level precision. Stakeholders can accurately calculate sand volume loss after major storms, predict flooding risks, and design effective beach nourishment and erosion control strategy.
Challenge
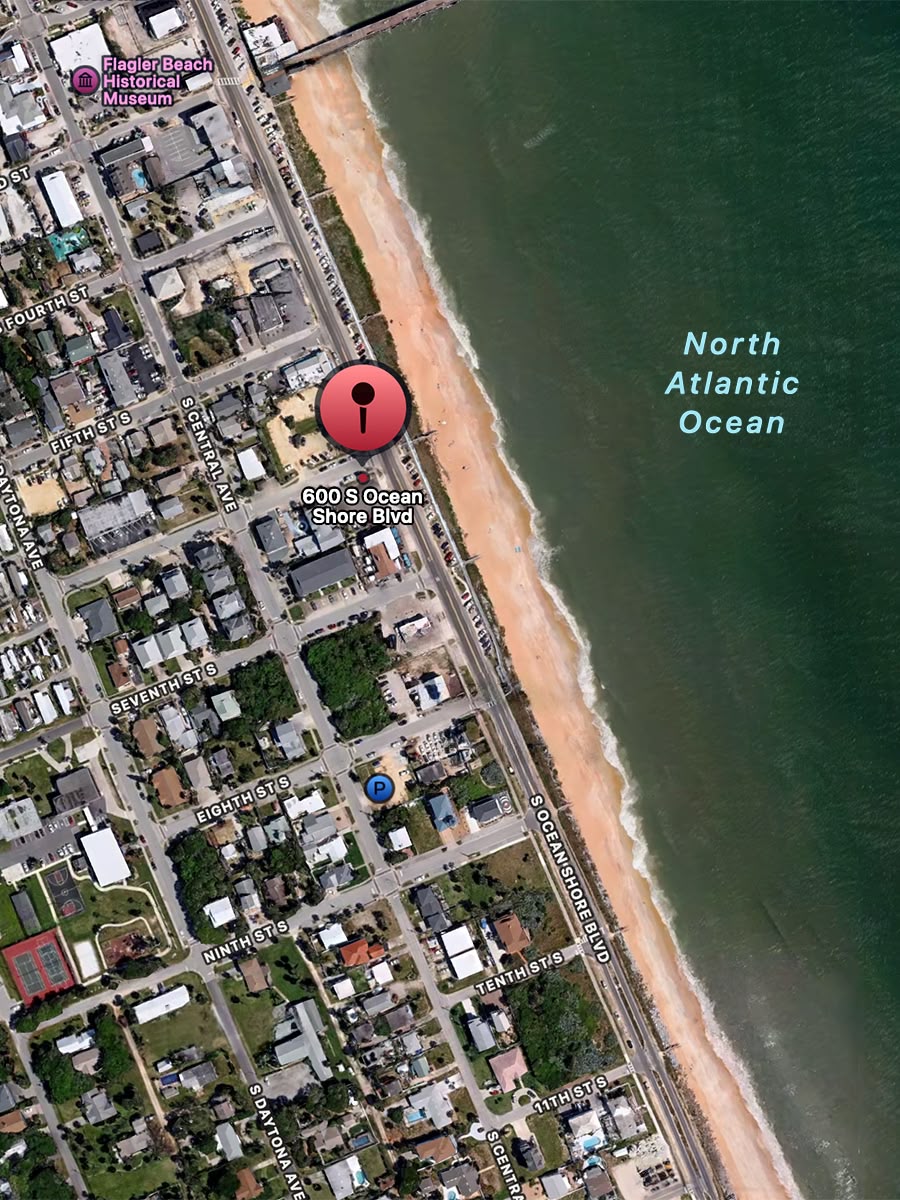
The survey area is located along the Atlantic coastline at Flagler Beach, Florida, where coastal processes continuously reshape the beach and dune system. Strong wave action, seasonal storms, and shoreline erosion create a highly dynamic environment that requires accurate and repeatable topographic measurements. Coastal erosion has been recognized as a significant challenge in this area, affecting both natural dune systems and nearby infrastructure, Figure 2.
The objective, in partnership with Basemap Consulting was to acquire a high-density, georeferenced LiDAR dataset capable of capturing detailed terrain information across the beach, dunes, vegetation, and adjacent infrastructure. Particular attention was required to accurately model elevation changes and dune faces while maintaining consistent point density over the entire survey corridor.
In addition, the proximity of the shoreline introduced several acquisition challenges, including moving water surfaces, reflective wet sand, and rapidly changing tidal conditions. These factors required careful flight planning and robust post-processing to ensure that only reliable ground measurements were retained in the final point cloud.
The resulting dataset provides a precise three-dimensional representation of the coastal environment, suitable for terrain modeling, shoreline monitoring, erosion assessment, and future change detection.
Solution
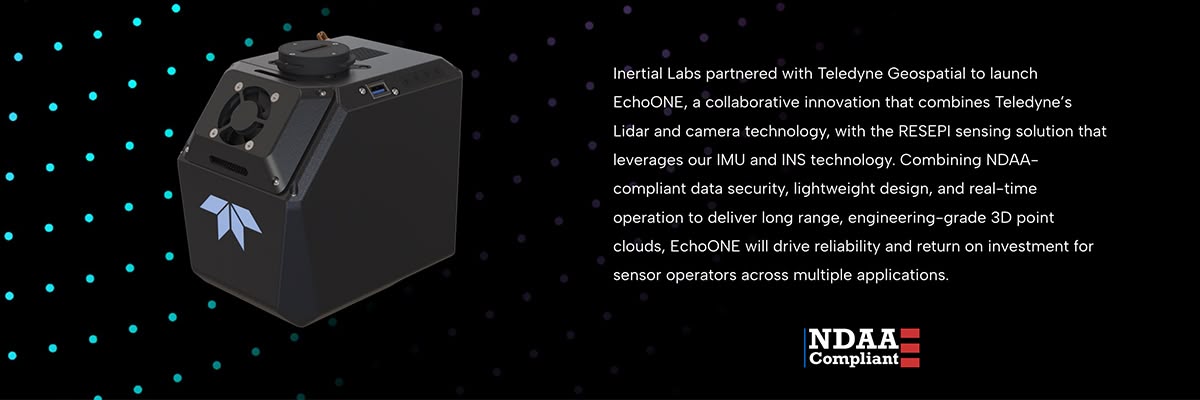
The survey was performed using the Teledyne EchoONE, powered by Inertial Labs RESEPI, which is an airborne LiDAR system, integrating a high-precision Teledyne Optech laser scanner with the RESEPI inertial navigation platform, Figure 3. The lightweight payload enabled efficient UAV operations while delivering engineering-grade point cloud precision with reliable georeferencing.
Mission planning was optimized to ensure complete coverage of the coastal corridor with sufficient overlap between adjacent flight lines. The selected flight parameters provided a dense and uniform point cloud capable of accurately representing beach topography, dune morphology, coastal vegetation, and surrounding infrastructure.
Mission Parameters
- The survey area covered a 30-hectare (74.1-acre) coastal corridor, and the shoreline area.
- It took about an hour to prepare for the mission, after which the drone remained in the air for 14 minutes, collecting data. Processing the data in the PCMasterPro software took about 20 minutes (depending on the computer’s processing power).
- The average flight speed was about 6 m/s at an altitude of 70 meters (AGL).
- Equipment: RESEPI EchoONE LiDAR System, WISPR SkyScout 2+ Drone, WISPR SkyBoss smart controller, Emlid Reach RS4 Base Station, and PCMasterPro software for data processing.
Results
After the mission, the collected LiDAR data was processed using PCMasterPro software. A cross-section of the point cloud is shown in Figure 4. To assess the precision of the resulting cloud, we took cross-sectional measurements to see the impact of noise in the areas of interest. You might ask, “Why is this important?” The answer is simple. As is well known, when constructing a Digital Surface Model (DSM), increased noise levels lead to localized irregularities in the surface model, manifested as small-scale roughness that does not correspond to the actual topography or terrain features. This is especially noticeable on flat areas such as roads, building rooftops, or open areas, where random scatter in measurements can be interpreted as real elevation changes.
For a Digital Terrain Model (DTM), the impact of noise is even more significant. Ground point classification algorithms (e.g., Progressive TIN Densification, Cloth Simulation Filtering, or Morphological Filtering) use local surface geometry to separate the ground from vegetation and man-made objects. High levels of random noise make it difficult to extract the true surface, increase the likelihood of point misclassification, and, as a result, lead to artifacts in the digital elevation model. Furthermore, during DTM interpolation, noise can spread to adjacent areas, reducing the accuracy of calculating slopes, aspects, earthwork volumes, and other derived geospatial products.
In this regard, we measured an important metric, Median Noise (1-σ), for the entire point cloud. Median Noise (1-σ) is one of the key metrics characterizing the quality of a point cloud obtained using LiDAR. It describes the random dispersion of measurements relative to the true surface position and is defined as the median value of the standard deviation (1σ) calculated for a set of local flat areas. In other words, this metric shows how “thick” a perfectly flat surface in the point cloud becomes due to random measurement errors. The results of these measurements are shown in Figure 5 where the nadir floor was also statistically computed across the dataset.
| Median Noise (1- σ) | Nadir Floor |
|---|---|
|
2.01 cm |
1.44 cm |
Figure 5. Sensor Noise Analysis Result.
A Median Noise (1σ) value of 2 cm indicates good point cloud quality and high measurement repeatability across most of the scene. A lower noise value in the nadir region (1.44 cm) confirms the expected improvement in measurement quality directly beneath the carrier, where the influence of range, scan angle, and geometric distortion is minimal. The maximum recorded noise value (5.7 cm) indicates the presence of isolated areas with degraded measurement conditions, which is typical for the edges of the scan strip and surfaces with unfavorable reflectivity. Median Noise (2.01 cm): Fits within high-to-medium survey-grade standards, like ASPRS. Very typical for high-end UAV LiDAR at standard flight altitudes (~50-100 m).
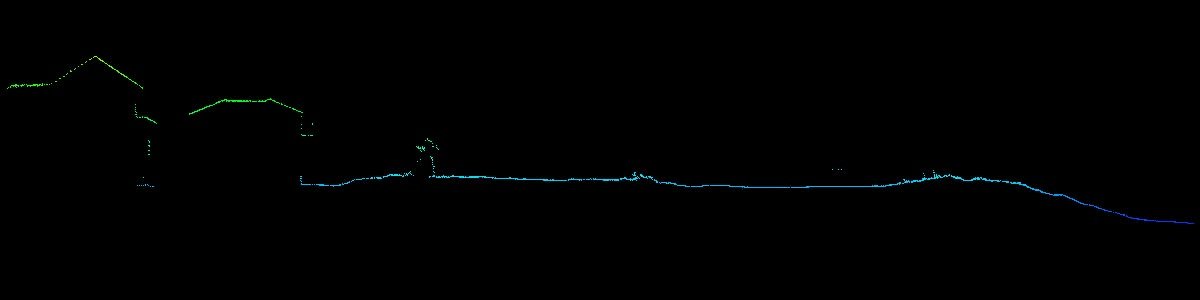
A closer look at the cross-section of the point cloud reveals that our results correlate well with the reported values, see Figure 6. The scatter of points does not exceed 2 cm on the section of the coastline that interests us.
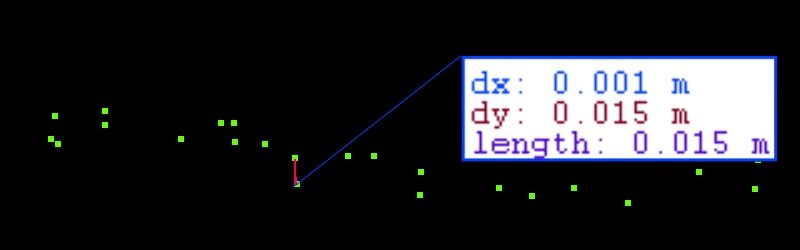
Thus, the resulting point cloud, with a density of at least 100 points per square meter, represents a highly detailed model suitable for coastal monitoring, terrain analysis, erosion assessment, volumetric calculations, infrastructure inspection, and long-term shoreline change detection.
Since our goal is to assess the condition of a specific coastal section for beach/dune restoration assessment and decision-making, we generated a DSM and DTM in the PCMasterPro, which were used to estimate the fill volume.
The DSM image is shown in Figure 7, we have taken one of the protective embankments as an example.
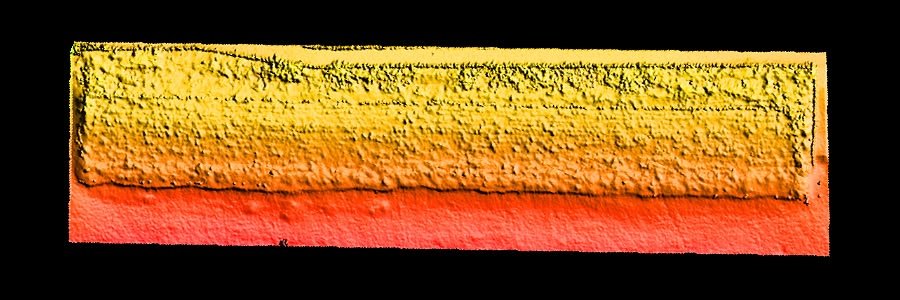
After calculating the volume, we obtained the following values:
- Cut: 7.8 m3
- Fill: 719.1 m3
Volume of eroded sand (Erosion / Cut)—the amount of the protective layer carried away by the ocean during the past storm season;
Volume of preserved or newly added embankment (Accretion / Fill)—the actual remaining engineering reserve.
Based on regular analysis of this data, engineers and hydrologists can predict how effectively artificial embankments and vegetated dunes are able to withstand ocean erosion. However, even the most accurate digital elevation models reveal an alarming trend: the rate at which natural defenses are being eroded in some areas is outpacing traditional restoration schedules.
Conclusion
By combining efficient UAV operations with the precision of the RESEPI EchoONE LiDAR system, the survey demonstrates an effective approach to acquiring high-quality geospatial data in dynamic coastal environments, Figure 8. The resulting point cloud provides a reliable basis for engineering, environmental, and coastal management applications while supporting future repeat surveys for accurate change detection.
The survey successfully demonstrated the efficiency of the RESEPI EchoONE LiDAR system for rapid and accurate coastal mapping. A 30-hectare (74.1-acre) survey area was completed with only 14 minutes of flight time, while the entire workflow—from mission preparation to processed deliverables—was completed in less than two hours.
The acquired point cloud achieved a density of more than 100 points/m2, providing detailed representation of the beach, dunes, vegetation, and surrounding infrastructure. Profile precision better than 2 cm ensured that the dataset is suitable for engineering-grade terrain modeling, shoreline monitoring, and volumetric analysis.
Flying at an average altitude of 70 m AGL and a speed of approximately 6 m/s, the RESEPI EchoONE mounted on the WISPR SkyScout 2+ delivered consistent coverage across the entire coastal corridor. The collected data were processed in PCMasterPro in approximately 20 minutes, enabling fast turnaround from acquisition to final georeferenced point cloud.
This project highlights how modern UAV LiDAR technology can efficiently produce high-density, high-precision datasets while minimizing field time, making it an effective solution for coastal monitoring, environmental assessment, infrastructure inspection, and repeat surveys for long-term change detection.
Contacts
Inertial Labs Inc.
Tel.: +1 (703) 880-4222
E-mail: il.sales@viavisolutions.com
Adresse: 39959 Catoctin Ridge St, Paeonian Springs, VA 20129, USA
inertiallabs.com